The stock market and the economy feel bifurcated. In an effort to walk with you through this situation, I have been sharing data that supports that the glass may be half full, not half empty like many seem to think.
This blog is the final part of a trilogy that discusses data on the current context of the market. The three points I discuss are, in order, as follows:
To recap, investor sentiment is a contrary indicator. The lower it goes, the more pent-up demand is created. Current investor sentiment matches the lows in May before the equity rally in June. Prior to this time, the indicator had not seen levels this low since February 2016. But today’s stock market is enjoying a “superfecta” of positive forces: widespread investor fears, an unprecedented policy push, a significant economic bounce from the “lockdown recession,” and an economy with limited room for improvement (starting with a double-digit unemployment rate).
My final point is that dispersion separates the current winners and losers of the subsectors in the S&P 500 — and the distance is growing wider. As a result, it may be more important than ever to concentrate your exposure, not diversify your portfolio performance into mediocrity.
Performance dispersion is a key driver behind the success of sector rotation strategies. As an executive, you know how to make data-dependent decisions. Consider this data on sector rotation strategies, courtesy of Nasdaq Dorsey Wright.
Blog: Source: Dorsey Wright
Relative Strength methodologies are objective and adaptable. They allow us to navigate market cycles by identifying leadership trends. Knowing when to own specific sectors and when not to hold them is of the utmost importance. A key driver of the success of sector rotation strategies is the performance dispersion that occurs between those sectors. In the image below, we show the broad sector performance quilt updated to highlight the performance dispersion between the ten broad US sectors since the beginning of 2010. This dispersion acts as the “fuel” for sector rotation strategies, as adaptive portfolios have the potential to capture more of the returns from more robust sectors while limiting exposure to weaker areas, producing added returns over time. The wider the dispersion is between the best and worst-performing sectors, the more potential we see.
![]()
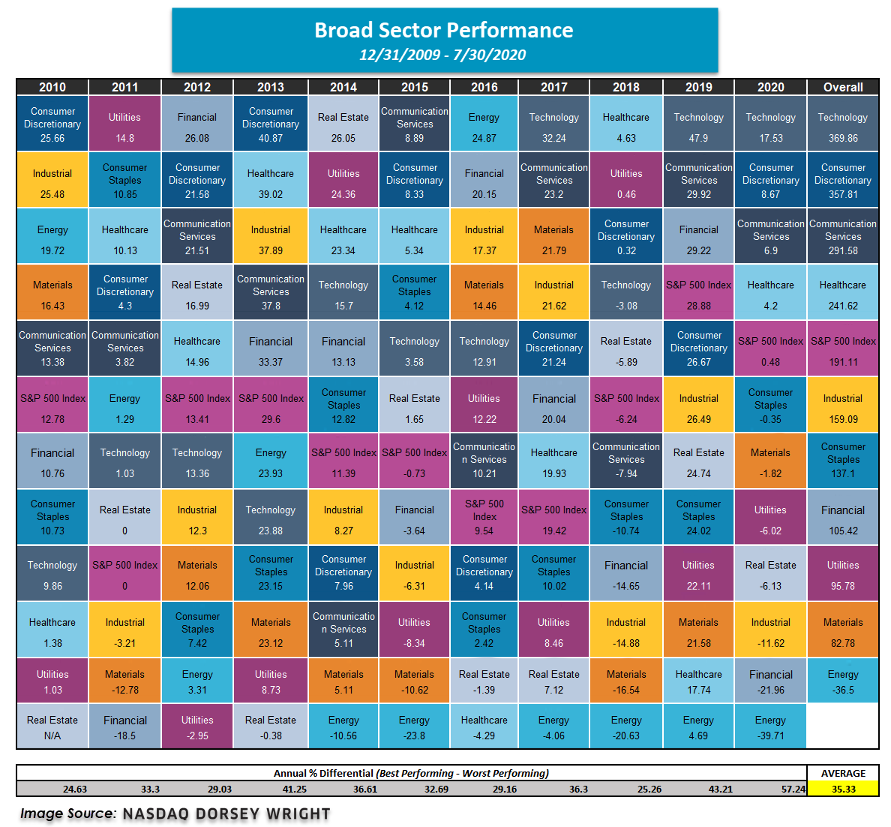
Introducing smaller market categories through sub-sectors or individual stock selection adds to that “fuel” by widening the dispersion. To illustrate, we have taken the 40 sectors and the ten S&P broad groups and shown their respective dispersions each year since the beginning of 2010. On average, the annual dispersion of the broad groups has been 35.33%. When we look at the average yearly dispersion for the 40 sectors, we see that value increases to 77.07%. Expanding the inventory is like casting a wider net to increase the potential for upside opportunity.
![]()

While I don’t know if our solutions would be a fit in your unique situation, I’ve got some ideas and best practices I’ve seen work well for executives like you. If you’re interested in learning more about them, let’s set up a brief, introductory call so I can learn about you to see whether it makes sense to schedule a demo. Click here to learn more about Nasdaq Dorsey Wright.