Gamblers at the horse track seldom pass up a chance at winning the superfecta (picking the first four finishers in exact order). Today, the stock market is enjoying its own superfecta of positive forces, which can win in any order:
- Widespread investor fears
- An unprecedented policy push
- A significant economic bounce from the “lockdown recession”
- An economy with limited room for improvement
In an effort to walk with you through this bifurcated time between the stock market and the economy, I want to provide you with data that supports that the glass may be half full — not half empty like many think. The stock market could certainly be ahead of itself on a short-term basis and will suffer periodic difficulties. However, stocks are feasting on. As a matter of fact, they’re likely to continue being supported by the stock market superfecta I listed above.
This blog is the second part of a trilogy that discusses the current context of the market. The three points I discuss are, in order, as follows:
To recap, investor sentiment is a contrary indicator. The lower it goes, the more pent-up demand is created. Current investor sentiment matches the lows from May, before the equity rally in June. Prior to this time, the indicator had not seen levels this low since February 2016.
For the second part of the series, I want to share a blog from the Leuthold Group that thoroughly charts this concept of a “stock market superfecta.” As you read it under the lens of your own unique financial position, consider your ability as an executive to make data-dependent decisions. It’s a useful experience to have while navigating the current investment environment.
Blog: Source: The Leuthold Group
A Superfecta!
While the S&P 500 is still off by about 5% (as of August 4, 2020) from its all-time high and is essentially flat since year-end, it has surged by 45% from its March bear market low. For many, its amazing recovery in the face of an ongoing pandemic and considerable evidence of strife on Main Street suggests caution is warranted.
However, at the horse track, gamblers seldom pass on a decent chance at winning the Superfecta—picking the first four finishers in exact order. And today, the stock market is enjoying its own Superfecta of positive forces, which can win in any order: widespread investor fears, an unprecedented policy push, a significant economic bounce from the “lockdown recession,” and an economy with so much room for improvement (starting with a double-digit unemployment rate).
Although the stock market will certainly experience pullbacks, disappointments, and corrections along the way, [I believe] the horses have just begun this race and investors should be wary of cashing-in a winning Superfecta ticket too early.
1. Cautious Investors!
Investors are no longer panicked like they were during the collapse in March, but they are still fearful of how this crisis will ultimately turn out and, consequently, are cautious with their portfolios.
This unease is not what is being recorded by bull/bear surveys, newsletter recommendations, or put/call ratios. Those are short-term sentiment measures that frequently shift bullish or bearish throughout a market cycle. Rather, several behavioral indicators illustrated in Charts 1-4 suggest a fundamental reticence to take risks. Combined, they characterize an underlying “wall of worry,” which is chronically providing support for this new bull market.
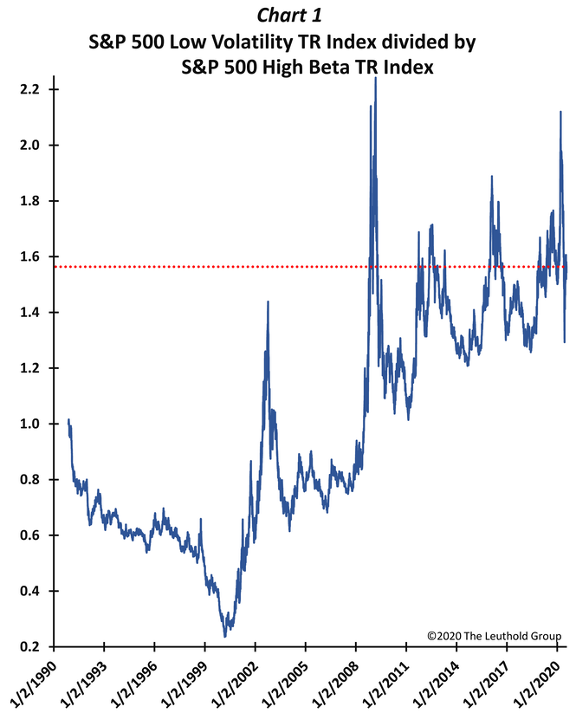
Chart 1 shows the ratio of the S&P 500 Low Volatility total return index (“risk-off” investing) divided by the S&P 500 High Beta total return index (“risk-on”). Regardless of the amazing S&P 500 recovery since its March low, investors continue to favor “relatively [stable]” investments. As shown, low-vol investing has been favored ever since the 2008 financial crisis (the ratio of low-vol to high beta has been perpetually higher compared to pre-2009) and the price of risk-off investing remains extraordinarily high relative to risk-on investments. Compared to 1990-to-present data, the current ratio is higher than 92% of the time, and even when shortening the time frame to the aftermath of the 2008 crisis, the ratio is in its 80th percentile.
![]()
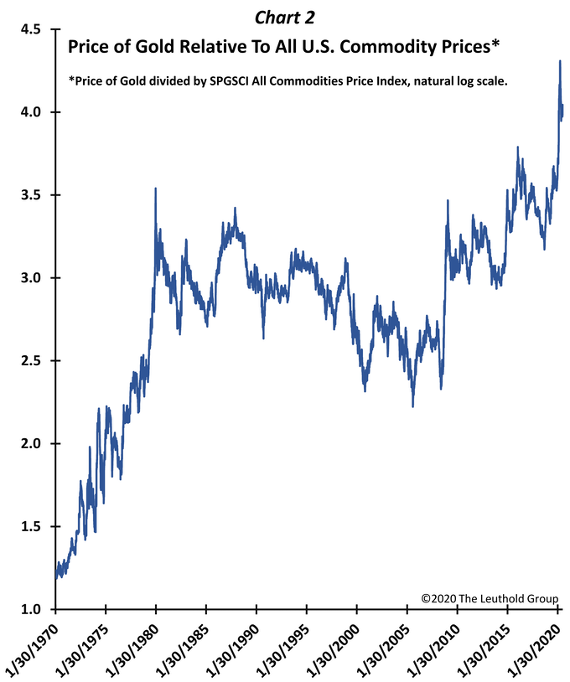
As Chart 2 illustrates, the recent popularity of gold also suggests a strong, underlying bearish cautiousness. Gold is extraordinarily popular now despite selling near a 50-year high relative to overall commodity prices!
![]()
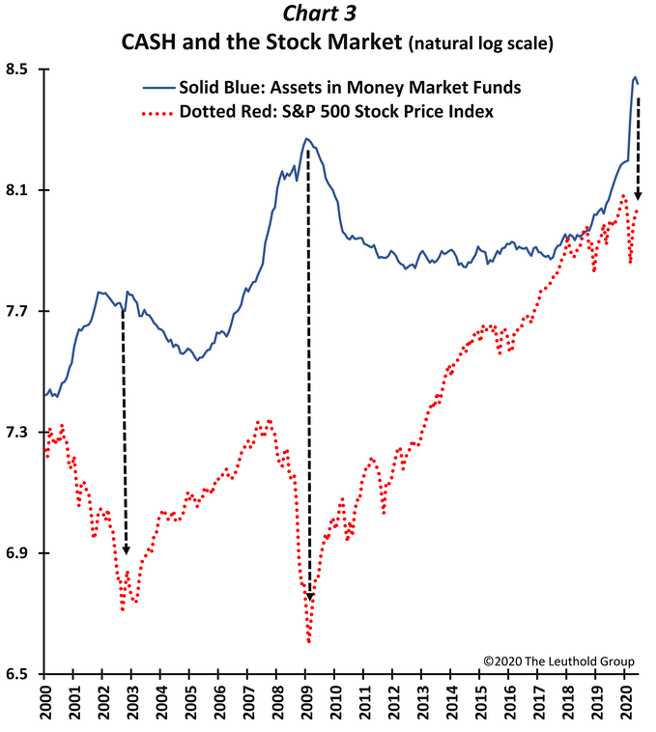
As with gold, investors appear mighty comfortable with cash (Chart 3) even though its yield is virtually nonexistent. In the past, when “dry powder” has surged as much as it has in the last 12-18 months, it eventually drove the stock market higher
![]()
Finally, mutual fund and ETF investment flows (Chart 4) continue to demonstrate investors are piling into bonds and out of stocks despite solid outperformance by the stock market in recent months and record-low yield offerings from fixed income.
![]()

Can the stock market “sustain” a meaningful decline when so many investors have already sold risk assets and are waiting for a pullback to boost positions at a “perceived” better entry point? With this backdrop, how strong is “buy on the dip?” Moreover, how much higher will the stock market need to advance before “underinvested” portfolios capitulate and add additional exposure?
2. An Unprecedented Policy Push!
Policy officials’ support for the financial markets is unprecedented (Chart 5). Today it is not simply “Don’t Fight the Fed.” Rather, it’s “Don’t fight the Fed, the U.S. Treasury, bond vigilantes (who have pushed yields to record lows), and nearly every monetary and fiscal authority across the globe.” The stock market has probably never enjoyed a policy foundation this massive and this broad-based!
![]()

This is not just about a stock market sugar high that will [likely] expire as soon as policy officials begin curtailing stimulus. In the end, sugar works for the stock market because it creates a “high” in the economy. As illustrated in Chart 5, the Economic Policy Indicator (a proxy for overall economic accommodation combining both monetary and fiscal juice) spiked higher and peaked near the start of every economic upturn of the last 50 years. Following each peak in the policy indicator, the ensuing economic expansion lasted for another 5.5 years, on average. In addition, a new bull market was initiated six of the last seven times that this indicator spiked (the exception was the 1980s’ double-dip era). From its peak, including the seven times since 1969, a new bull run lasted an average of just over 4.6 years and provided investors with an S&P 500 annualized total return of +15.1%!
The extraordinary and massive economic policies being employed in this crisis improve the odds, dramatically, that a new economic recovery has begun, and its corollary bull market is probably only in its early innings.
3. The Economy Is Bouncing!
The first-ever “Recession by Proclamation” caused an unparalleled collapse in the U.S. economy. Now, however, is the economy in the early stages of the first-ever “Recovery by Proclamation?” The switch was turned off and is now being turned back on! It will take a long time before economic conditions return to normal—some economic pursuits may forever be changed and setbacks along the way should be expected as virus cases again spike. Indeed, most recently, new hot spots have paused “restart” initiatives in several states. But, in cool spots, where virus activity is less pronounced, economic momentum continues to mend. Moreover, although economic activity has recently bounced, in general it remains remarkably depressed, thus offering considerable room for more improvement.
To gauge this impact, we recently introduced the U.S. Economic Bounce Indicator (Paulsen’s Perspective, June 3, 2020), which is overlaid in Chart 6 with the S&P 500. The bounce indicator is formed from seven, timely economic gauges. These were chosen because they offer weekly insight and span economic activities. The barometers encompass corporate profitability (Wall Street’s consensus earnings estimate), the job market (unemployment claims), the housing sector (purchase applications), industrial activity (industrial commodity prices), retail sales (Johnson Redbook), a confidence measure (Consumer Comfort Index), and an indicator of economic news flow (Economic Sentiment Index).
![]()

All show a swift and massive collapse caused by the pandemic, and each is now in some stage of recovery. What is clear, however, is that each barometer (perhaps excluding mortgage applications) still has considerable room to improve further and will likely do so as economic activities continue to restart in the weeks ahead. There is a legitimate debate over how much, and how fast, various aspects of the economy will recuperate. But, the direction for the economy is likely to remain upward, even if the revival proves slow and growth ultimately leaves aspects of the economy far below pre-crisis levels.
As shown, during the last 23 years there has been a close (although not perfect) relationship between the bounce indicator and the stock market. Importantly, every major rise in the bounce indicator has been associated with a meaningful advance in the U.S. stock market. For all weeks since 1997, the S&P 500 rose at an average annualized pace of +25.6% (about +44 basis points weekly) whenever the bounce indicator increased in the same week; however, the S&P 500 declined at a -9.2% average annualized pace (a decline of 18.4 basis points weekly) during weeks when the bounce indicator fell! Furthermore, in weeks when the bounce indicator declined, the S&P 500 suffered a weekly loss 50% of the time compared to only 38% of the time in the weeks when the bounce indicator rose. Obviously, it is the “direction” rather than the “level” of the bounce indicator that matters most for the stock market.
Returning to normal may not be that important. The stock market seems poised to continue rising irregularly even if the economy is still subpar, provided its “direction” trends toward improvement. So, “Don’t Fade the Economic Bounce.”
4. Divot Repair!
The pandemic dug a huge “divot” in the U.S. economy. Although this has caused considerable pain on Main Street and left the economy in a very subpar position, it has also increased the potential for enhanced economic performance over the next several years. The U.S. economy currently has a double-digit unemployment rate, significantly lower company profitability, a productivity collapse, widespread company closings, and weak consumer spending.
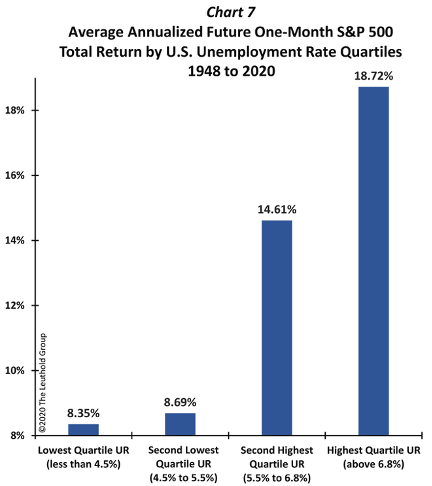
Although recessions are painful, they also create the opportunity for an upturn that can last for several years. As shown in Chart 7, since they began reporting the monthly U.S. unemployment rate in 1948, the best future stock market returns have occurred when the unemployment rate was high. The S&P 500’s future average annualized total return is only +8.5% when the U.S. unemployment rate was below 5.5%. But the stock market achieved a total return of +14.6% per annum when the unemployment rate was between 5.5% and 6.8%, it gained almost +19% per annum when the unemployment rate was above 6.8%, and +25% per annum (not shown) when the unemployment rate was above 8%!
![]()
Why does the stock market produce better returns when Main Street angst is elevated? A high unemployment rate signals the outsized potential that future economic conditions are destined to revive because employment will ultimately recover—which, in turn, boosts incomes, raises spending, and speeds profit growth… thereby boosting the value of the stock market. In this sense, the colossal economic divot the U.S. is now experiencing also indicates the opportunity to substantially expand economic activity during the next several years, and thereby chronically support the stock market.
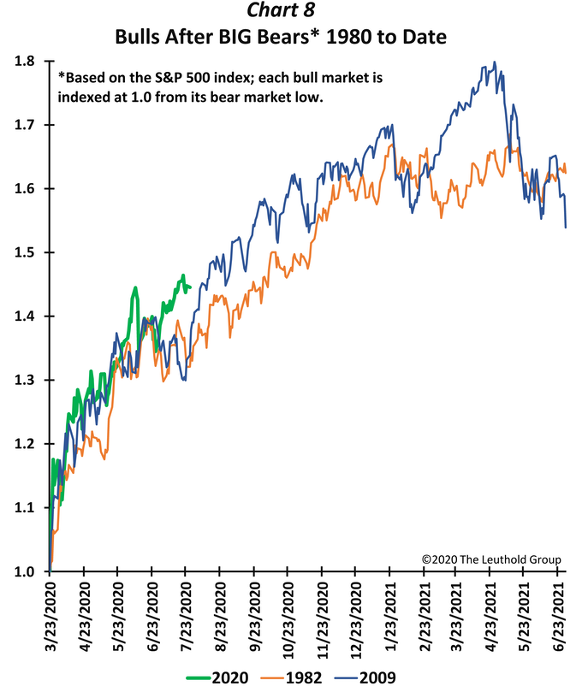
As shown in Chart 8, it is no coincidence the current bull market is tracking very closely with the bull markets of 1982 and 2009. The recessions of 1982, 2009, and today, produced the three highest unemployment rates of the entire post-war era. Because each began with extremely high levels of unemployment, they each possessed the uncommon opportunity for outsized economic progress. The economy faces serious problems today—just like the pronounced challenges after both the double-dip recession of 1980-82 and the Great Recession of 2008-09. Nonetheless, those previous recessions were followed by bull markets that feasted for years on the ability to persistently improve the unemployment rate. [I believe] this opportunity exists again today.
![]()
Summary
The stock market could certainly be ahead of itself on a short-term basis and will suffer periodic difficulties. However, stocks are feasting on—and will likely continue being supported by some major favorable forces: cautious investors, massive policy support, a bouncing economy, and one of the biggest economic divots ever experienced in U.S. history.
So, stay diversified but also keep a tight hold on that “Superfecta Ticket!”
While I don’t know if our solutions would be a fit in your unique situation, I’ve got some ideas and best practices I’ve seen work well for executives like you. If you’re interested in learning more about them, let’s set up a brief, introductory call so I can learn about you to see whether it makes sense to schedule a demo. To learn more about the Leuthold Group, click here.