A Foreword from John Pulliam
In “Antifragile: Things that Gain from Disorder,” Nassim Taleb challenges the orthodox, and I love every part of it. There are many important concepts in this book. A partial list of my notes on this book tell the story:
- Conditions for adapting allow for new approaches to be tested.
- Tell the operators what they need to know in real time in a way they understand.
- Make failure survivable.
- Knowledge expands via trial and error. How do we track your past successes and failures?
- Complex systems are weakened or killed when denied of stressors.
- The greatest generator of crisis is lack of “skin in the game.”
- At no point in history are so many non-risk takers exerting so much control.
- Complications always lead to multiple chains of unanticipated effects.
- Fragility is that which does not like volatility, randomness, uncertainty, dis-order, and stressors.
- No guts, no belief. The extended disorderly family is coming. How you prepare, or not, matters.
- If the goal is financial independence, there comes a time to get serious about it.
- A little bit of agitation makes species prosper. It isn’t peace; it’s freedom.
- Noise is what you are supposed to ignore. Signal is what we need.
- Our track record in forecasting statistically small events in politics and economics is not close to zero; it is zero.
And one more…
- The goal is to acquire the right amount of wealth, to buy the right amount of possessions that make it possible to have the experiences I desire.
These notes are like a collage to understand what I do for the families I collaborate with. The conditions and catalysts were ripe in February 2020 for disruption, and the overbought, overpriced, and overextended U.S. equity market adjusted. As you challenge the orthodox of Wall Street or your own thinking, consider how fragile we have become during this “longest recovery in the history of the stock market.” What would you expect to see if your most basic assumptions were incorrect?
Calculate your Safe Withdraw Rate using U.S. valuations. Overlay that Safe Withdraw Rate with your lifestyle spending. Consider calculating how fragile your walk-away money is to providing the experiences you desire.
There has never been a thirty-year period for the stock market when investors have lost money; yet there have quite a few thirty-year periods that have bankrupted senior citizens who were relying upon their stock portfolios for retirement income.
Destitute At 80: Retiring in Secular Cycles
By Ed Easterling
January 12, 2007
All Rights Reserved
The Golden Goose
Whether you are there now or saving to be there one day, retirement for many is that time when we use the “goose” that we have built over many years of toiling and saving to fund our retirement. For those of us that are still building the nest egg, we want to know how much will be required to meet our needs. Upon retirement, we need to know what level of income (or withdrawals) from our investments that we can have each year to sustain our lifestyle—the safe withdrawal rate of “golden eggs” from the “goose.”
The withdrawal rate is the percent of the starting portfolio that can be harvested each year for living expenses. For example, a retiring couple with $1 million that needs $50,000 to supplement social security would be taking a withdrawal rate of 5%. Of course, expenses rise each year due to inflation and our couple certainly wants to sustain a comparable lifestyle. Therefore, the withdrawal in future years should keep pace with inflation. As a result, there is a key assumption for retirees about the initial and continuous rate of withdrawals from their investment portfolios to be safe from failure.
The Concept of SWR
Safe Withdrawal Rate, or SWR, is an actively discussed—and debated—concept among retirees, financial planners, and investment advisors. SWR relates to the percentage of an investor’s portfolio that can be safely withdrawn each year following retirement for life’s expenses. The key variables are (1) success rate, as reflected in the percentage risk of not running out of money; (2) portfolio mix and return assumptions; (3) how long the retiree assumes that they will live; and (4) a variety of other variables including tax rates, investment expenses, etc.
In general, most analysts and models say that a retiree can withdraw 4% to 5% of the original balance each year, increased annually to cover inflation, and still have a very good chance of not running out of money. A retiree today has a relatively long-term horizon, with an average retirement age near 60 and an expected lifespan for the last surviving spouse of almost 30 years. Some will go so far as to advocate that today’s long-term retirees invest heavily in the stock market. Those pundits say that a market which has never lost money over thirty-year periods won’t let you down in the future.
So let’s assume that a retiree invests heavily in the stock market—because they “need” the extra return and should feel “safe” that over a thirty-year period that Mr. Market will not let them down. For our retiring couple, let’s also assume no taxes or investment fees, commissions, or other charges—yes, these are aggressive (“optimistic”) assumptions, so this probably delivers the best-case scenario or conclusion.
We now have the last three elements settled: (a) the portfolio mix will be a diversified stock market portfolio using the S&P 500 Index including dividends, (b) the last surviving spouse will need money for at least 30 years, and (c) there are no taxes or investment expenses. What are our chances of success…of not running out of money and avoiding a job greeting shoppers at Wal-Mart after age 80?
On Average
If you are interested in SWR, you are likely affected by it. Despite the use of average assumptions, your results will unlikely be “average” even over decade or longer periods. It could be better than average or it could be worse than average. Regardless, as far as success is concerned, your results will be binary—either you will be successful or not. It does not matter whether you—on average—have a 75% chance of success. For you, it will either be 100% or 0%…you will either have enough or you will run out. So although probabilities are interesting, you are keenly focused on the implications of the assumptions and the likely impact that they have on your future.
Using history as our laboratory to assess the likelihood of success, a retiring couple that starts with withdrawals of 4% has a 95% chance of success…of not running out of money before the average last surviving spouse no longer needs withdrawals. For example, this represents an initial $40,000 for a retiree with $1 million, increasing the $40,000 at the start of each year by inflation. By the way, keep in mind that (by its definition) about half of you will live past the expected average lifespan. Thus, these success rates are actually lower for the half of retirees that will live past the expected lifespan.
“Risk management is not about enhancing success; it is about avoiding the failures that are unacceptable.”
Well, a 95% chance of success sounds pretty good—on average. On a more personal level, I am an investment manager with a high propensity for risk management. So as you might expect, I think much less about the 95% success rate and a lot more about the 1 in 20 chance of cat food or a Wal-Mart job at 85. And in some of the cases, I might even be destitute at 80.
If you have enough money to be thinking about SWR, you likely have a lifestyle that you don’t want to compromise. Further, when you think about last-to-survive issues, it has even greater significance.
To illustrate, when the doctor comes in and says that your upcoming surgery has a good success rate: a 95% chance of success. He further says that he does this procedure five times a day. Since five-a-day represents about 20 per week, how many of you will immediate hope (wish) that you will not be the one that week that does not make it. In this case, risk management is not about enhancing success; it is about avoiding the failures that are unacceptable.
So let’s return to our analogy about the surgeon. Although a 95% success rate sounds good to all those who are standing around the operating table, it is quite different for the one who is actually on the table. The patient will be thinking about his or her particular circumstances…whether their odds are more likely to be above or below the 95%.
Before digging into the details, what does the overall average look like? Over the 78 thirty-year periods since 1900, the average retiree that started with $1 million could have withdrawn 4% plus actual inflation each year and ended with $6.7 million—6.7 times as much as they started with—even after withdrawing 4% plus inflation every year for thirty years. As for failure rate, only 4 of the 78 periods ran out of money.
But what about me? For stock market investors, the most significant factor that determines future returns is the level of valuation (measured as the P/E ratio) at the time of initial investment. So for each of us, the level of the P/E at retirement has a significant impact on our chances of success.
When we dig further to understand the success rate for a retiring couple today, we can dissect the past history into four sets, so-called quartiles. These sets are ranked from the highest to the lowest starting P/E ratios. The result is that the highest quartile (i.e. the top 25%) includes all thirty-year periods since 1900 that started with P/Es of 18.5 and higher. The second set (i.e. the second 25%) cuts-off at a P/E of 13.9; the third at 11.2; and the last at 5.3.
Why does this matter? Although the success rate for the entire group was 95%, today’s retiree starts with P/Es over 18.5 and has an expected success rate of less than 80%—one per day for our surgeon rather than one per week.
When P/Es started at relatively high levels, it had a major impact on future success. When P/Es started at relatively lower levels, returns always were sufficient for 4% withdrawals.

Source: Crestmont Research
As Figure 1 reflects, the level of valuation (P/E) has a direct impact on success and ending capital. The implication for today’s investor is that the likelihood of financial success in retirement is considerably less than most pundits are advocating. Twenty years from now, if the response is “who knew?”, it won’t be much comfort for retirees in the employment line at Wal-Mart. This is especially true since a rational understanding of history and the drivers of longer-term stock market returns can help today’s retiree to avoid that “surprise.” I assure you that these are not fear-driven statements, but rather insights that are based upon history and the financial principle that valuation is a major determinant of future returns.
As presented in Figure 1, covering the 78 thirty-year periods since 1900, the top 25% started with P/E ratios of 18.5 or higher. Within that 25%, about 1 in 5 (20%) of the thirty-year periods had the investor running out of money before the end of the period. When that occurred, the investor was out of money on average during the 27th year. Yet—on average, including the successful periods within this quartile—the average investor ended the thirty years with almost $2.8 million.
Please keep in mind that success provides a wide path, yet failure is a thin line. Those that succeed will end with a little or a lot: Those that fail get to zero…or start eating cat food as the savings dwindle. Further, in reality for retirees that invest during top quartile periods, the chance of suffering the painful effects of failure is even higher than 21%. Since a few of the periods ended relatively close to zero, some retirees toward the end were forced to drastically reduce spending as their portfolios dwindled.
For most investors over the past century (the ones that were fortunate enough to retire when stock valuations and P/Es were lower), they had much better results. As reflected in Figure 1, the benefits were directly and inversely proportionate to the starting level of valuation. As the starting valuation declines, the average ending portfolio increases. This is another example of how the starting valuation has a big impact on future results.
But I want 5% (rather than just 4%)…
A number of advocates and studies provide for 5% withdrawal rates: “I only want $50,000 from my million dollars” and have it last for 30 years. The calculated success rate for that rate of withdrawal is 73%. Pretty good odds…except when we consider the impact of valuation.
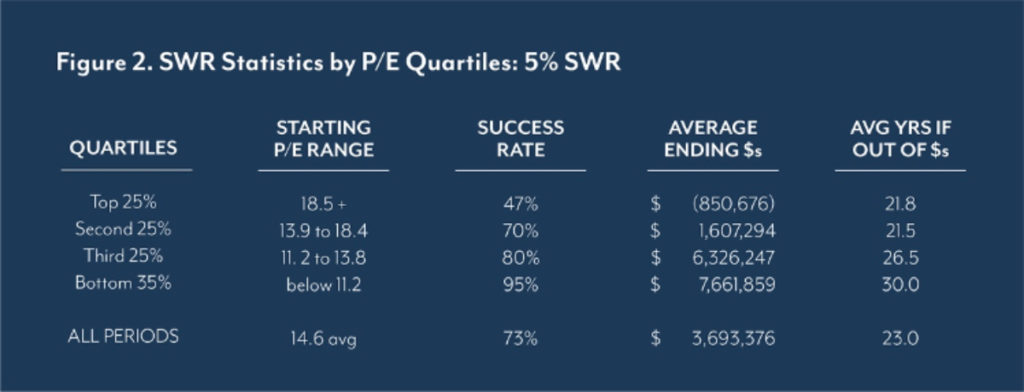
Source: Crestmont Research
As Figure 2 shows, although the average may have been 73%, some periods presented odds less than 50% while others were more than 95% successful.
As discussed in this article and in Unexpected Returns (a layman’s book to understanding what drives periods of above-average and below-average returns in the stock market), there are fundamental drivers to stock market returns. In Figure 2, we can again see that periods starting with higher valuations have lower success rates, lower average ending values, and shorter periods before bankruptcy. This further highlights the direct impact of valuation on portfolio returns and the resulting success rate for surviving retirement.
Conclusions
As you try to better determine the odds that drive whether it will be success or cat food, the starting level of stock market valuation (P/E) has a direct impact on your outcome. It does not matter that most scenarios provide your heirs with multi-millions; you are obviously more concerned about reducing the chances that a few scenarios have you trying to work again at 80.
Although history provides an average outcome across a wide variety of market conditions, it is only relevant today to consider periods with characteristics similar to today. Given the significant impact of valuation on returns, that factor will be a major driver for today’s investors and retirees.
As we are now in the upper quartile (i.e. top 25%) of valuations, our expected results are well below average. So much so that realistic expectations or portfolio management is needed for potential success.
If you can live off of a 3%, or maybe 4%, withdrawal rate, then today’s financial markets should provide you with retirement success. If you need 4% to 5%, then you will need a more consistent and higher return profile for your portfolio than simply passive investments in today’s stock market. For that, you will need more actively-managed and value-added approaches toward investments.
There is no magic solution; no “one-way” to achieve success. Current market conditions require intense study or financial expertise. Crestmont Research (through the analyses and articles on its openly-accessible website) can help to provide a few insights about the environment.
This material is provided for educational purposes only and does not constitute investment advice. The information has been obtained from sources considered to be reliable, but we do not guarantee that the foregoing material is accurate or complete. Investing involves risk and you may incur a profit or loss regardless of strategy selected. Past performance does not guarantee future results. Keep in mind that individuals cannot invest directly in any index. The S&P 500 is an unmanaged index of 500 widely held stocks that is generally considered representative of the U.S. stock market.
Ed Easterling is the author of Unexpected Returns: Understanding Secular Stock Market Cycles, President of an investment management and research firm, and a member of the adjunct faculty at SMU’s Cox School of Business where he teaches the course on alternative investments and hedge funds for MBA students. Mr. Easterling publishes provocative research on the financial markets at www.CrestmontResearch.com.