Parker Palmer says that “the true role of the financial professional is to help you remove the illusion of certainty and to reveal the reliable truth on which to build a solid financial strategy.” We achieve that by taking a disciplined, rules-based approach to finance.
This approach allows us to separate the knowable from the unknowable and the important from the unimportant. We focus on the “knowable-and-important quadrant” as an investment tool because it is the only quadrant that produces repeatable and dependable results. It’s a discipline revealed by the supply and demand of global risk.
We believe that what you count, counts. Our discipline to quantify global risk and apply it to executives is captured on our Dashboard — a primary driver of which is the Dynamic Asset Level Investing (DALI) tool. Take a minute to schedule a 15-minute demonstration of our Dashboard and discuss the historical changes that occurred between 2000 and 2003, in 2008, and in 2020 today.
Without the illusion of certainty, and in pursuit of a reliable truth, consider this brief explanation of DALI since February 2020.
Blog: Source: Dorsey Wright
Over the course of the past few months, we have been through the wringer with respect to the market. On February 19th, 2020, the S&P 500 was at an all-time high of 3390, and just over a month later the S&P 500 was down at 2200 in what felt like the blink of an eye. It was the fastest fall of more than 20% off a market high. In the middle of all that, the nearly four-year reign of Domestic Equity came to an end as the number one ranked asset class in DALI. On March 13th, Domestic Equity slipped out of the top two spots and ultimately fell to number four. As the market has recovered back to the 3000 level, Domestic Equity has improved back to number three but is taking aim back at one of the top two spots. What will it take for that to happen?
The DALI tool is meant to be a big picture, long-term view of where we see relative strength in the global marketplace, with the key term in this evaluation being the relative strength nature of the comparison. DALI is built using underlying relative strength comparisons of various funds from each asset class in a large relative strength matrix, which we then aggregate into the broad rankings. Each asset class has an equal amount of broad representative ETFs that we use in the underlying matrix, which is meant to embody the significant aspects of the six broad asset classes.
The aggregate signal count of the DALI tool causes it to be something that does not change very often, leading to significant shifts when we do see a change. These changes are also not undone easily, as the signal changes that led to the movement of the asset classes need to be reversed before we can see an asset class rise in the rankings.
There are currently 61 signals separating the number two ranked asset class (Fixed Income) from Domestic Equity. At it’s widest margin, that number was 107, meaning there were 107 buy signals separating Fixed Income from Domestic Equity. We have seen a meaningful closing of the gap but still have some work to do. There are a number of charts that have returned to buy signals for US Equity, like the chart of the S&P 500 ETF versus Investment Grade Corporate Bond.
The reality is, as we stand now, there are also a number of charts that did not experience the back and forth action due to the speed and velocity of the sell-off in Feb/March and the speed of the recovery since late March. So, there are some charts that look like the S&P 500 versus Aggregate Bond ETF that are still aways from returning to buy signals if this market continues to go up from here.
While the SPX versus AGG is the “scary” example of what it would take to see Domestic Equity return to the number one or two position, the fate of DALI doesn’t hinge on one specific chart. As we outlined above, it is the culmination of all of the Domestic Equity representatives versus all of the representatives from all of the other asset classes. One way to think about this is college football. Remember what that is? It has been since we’ve been able to actually watch a live sporting event that it seems like a foreign concept, but think about college football for a minute. There are a number of different conferences, and within those conferences, there are a number of different teams. Here, the conferences are like the asset classes in DALI. If the Clemson football team, who’s in the ACC, goes out and beats Alabama who’s in the SEC, does that mean that the ACC overall is a better conference than the SEC? Not necessarily. It would mean that Clemson was the better team. We would need to set up a tournament where all of the teams from the ACC played all of the teams from the SEC and tally up the win-loss record. The conference with the highest number of collective wins would be deemed the better conference.
This is how we view DALI. With that said, through Tuesday’s (5/26) close, there were about 30 RS relationships within 10% of returning to buy signals for Domestic Equity, and about half of those are within 5%. So, this means that if we see dispersions of another 10% between these Domestic Equity components, Domestic Equity has the ability to pick up another 30 signals and a number of those would come at the expense of Fixed Income. Such action would narrow the gap substantially. This doesn’t necessarily mean that the market has to go up another 10% as it’s the dispersion between the two things that is important. So, the market could go up 5% and the other side could go down 5%, or any combination to get to a 10% difference. Another thing that we will continue to watch is some of the weaker asset classes “stealing” signals from the more defensive asset class. As a result of Tuesday’s market action, International Equity picked up 8 new buy signals, and most of those came at the expense of Cash and Fixed Income. There are another 26 RS charts that are close to returning to RS buy signals and a number of those are against Fixed Income representatives.
Below is a chart of the historical tally signals for Domestic Equity and Fixed Income. This current period is just the fourth time where the tally signal count for Fixed Income is higher than Domestic Equity. The previous time periods were February 2001 to June 2003, July 2008 to May 2009, and February 2016 to August 2016.
![]()
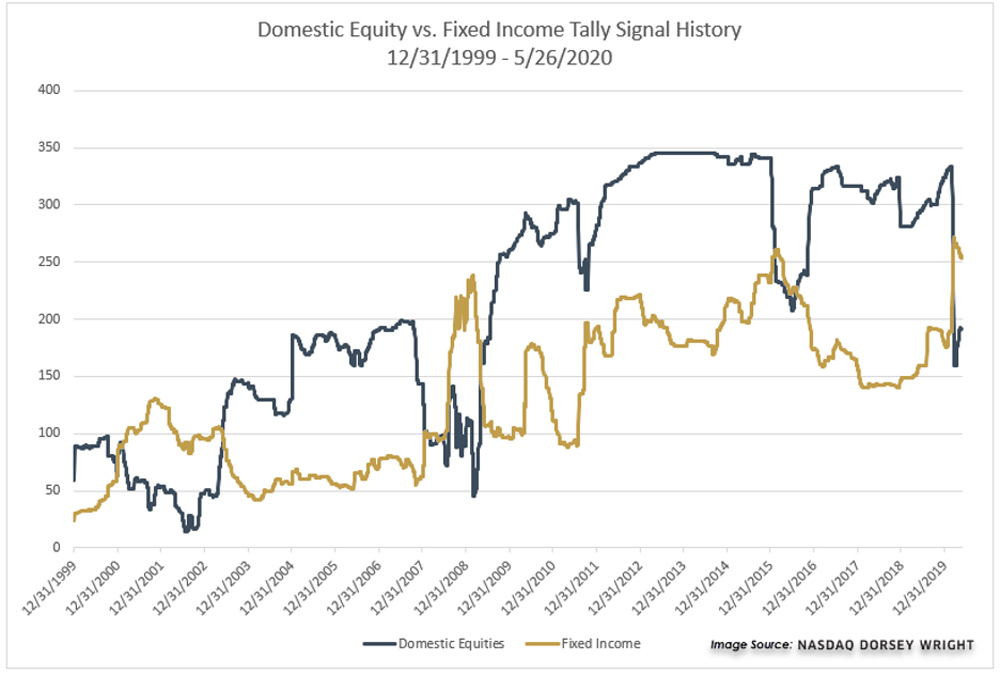
Source: Dorsey Wright
To craft a disciplined approach to your asset management, schedule an appointment with Pulliam Family Office — and to learn more about Nasdaq Dorsey Wright, click here.