Risk on or risk off? Portfolio positioning, as a result of the answer to this question, is the single largest attribution to performance since the technology-led market boom of 1999.
Let’s be clear. I’m not advocating for market timing. We can all agree market timing does not work. However, every executive that I meet, without exception, plans and executes their company strategic design with an eye toward risk versus reward.
These same executives intuitively feel the disconnect to Wall Street’s “buy and hold” attitude, constructed to keep clients invested and paying fees. After two peak-to-trough declines of 50% and 63% during the Tech Bust (2000) and Great Recession (2008) respectively, executives should be demanding more than the “table stakes” offering presented by most advisors.
Two facts fuel the natural destruction of wealth for executives at public companies:
- The executive, tightly coupled financial system is characterized by income, bonuses, and concentrated company stock position, and these have a near perfect correlation. They all go up and down together — and at the same time.
- Behavioral finance suggests that people feel best about their financial position at market tops, and their worst at market bottoms.
Recognition of these facts partially drove Warren Buffett to wish for investors to become fearful when Wall Street is greedy — and to become greedy when Wall Street is fearful.
I believe the executive must also address their tightly coupled financial system while they are reversing the emotions of fear and greed, as advocated by Warren Buffett. The solutions will vary per executive as they reduce how fragile they are to market disruption. My ability is to provide a rules-based process to rotate through simple market holdings, including money market. This discipline changes the relationship between performance and risk.
Historically, there are some critical thresholds that need to be respected while using a disciplined model of market assets. I have the highest respect for money market flows and U.S. capital market flows. Simply put, they can be used as a two-factor authentication resulting in risk on or risk off.
Consider the below insights provided by investment advisory firm Nasdaq Dorsey Wright at the start of the month:
In today’s Fund Score Overview: we review Percentile Rank (PR) and Money Market Percentile Rank (MMPR) triggers and their recent contexts, as well as cover risk measurement fundamentals relative to the market. I guess it’s okay to have a cerebral day every once in a while.
(PR4050 – Percentile Rank with Core Level below 40 and Money Market Level at or above 50)
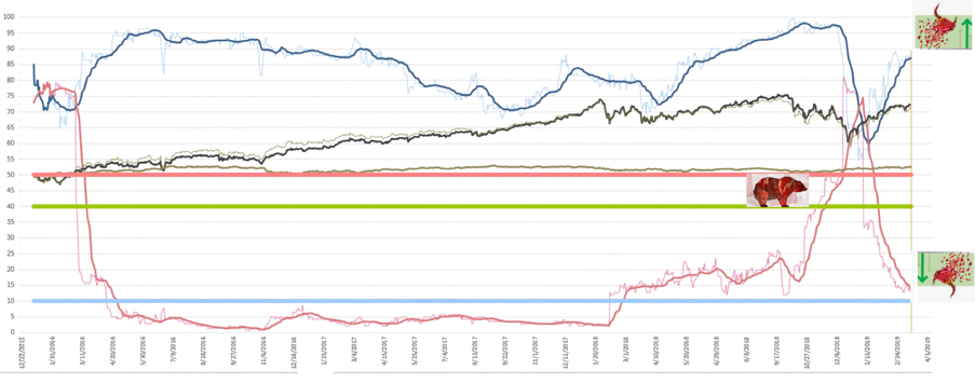
The following graph demonstrates the movement of the U.S. Equity Core Percentile Rank (PR) and the Money Market Percentile Rank (MMPR) levels as filtered through a modest moving average over the last few years. The black and grey lines are a representation of the price of the Core Equity market and then the Core Bond market, centered in the graph for some relative perspective. Moving averages on the raw readings is possibly the next step in evolving this indicator relationship.
But first you will want to pay some attention to your Red line which if the Money Market percentile rank you probably are most familiar with as it measures how strong the Money Market is compared to all other asset classes. Many models follow the 50% level trigger shown with the red horizontal line. The blue line is the Core percentile rank levels, which it could be the case that you are least familiar with and it measures how strong the Core S&P 500 stock pool is versus all asset classes around the world. Models that follow the PR4050 combination look at the same MMPR trigger only if the Core PR level moves below the 40th percentile. A Two-factor authentication is what this boils down to. Now both indicators triggering their alarm levels has not occurred since 2008, even though one of them has in 2018-19 and 2015-16. What you would want if you can get it, is to have these 2 lines stay far away from each other, with the blue one on top. But as they meet somewhere in the middle, the clash is usually a hair-raising event that definitely impacts the color of the sky in your world.
And the summary is…. The better we all get at evolving this type macro Indicator guidance, the better the FSM strategies will meet expectations. And improving the current mechanics to be more and more helpful is not just a theoretical goal, but a very tangible and reachable goal.
![]()
For help crafting a disciplined approach to your asset management, schedule an appointment with Pulliam Family Office. To learn more about Nasdaq Dorsey Wright, click here.