A disciplined, rules-based approach wins over time — not every time, but over time.
It is widely reported that the U.S. equity market and the S&P 500 have been extremely difficult to beat over the past few years. Since 2011, the percentage of funds outperforming the S&P 500 on a five-year basis has been reduced from 70% of funds to less than 10% of funds.
It begs the question: Should you be paying fees to an advisor in such an environment?
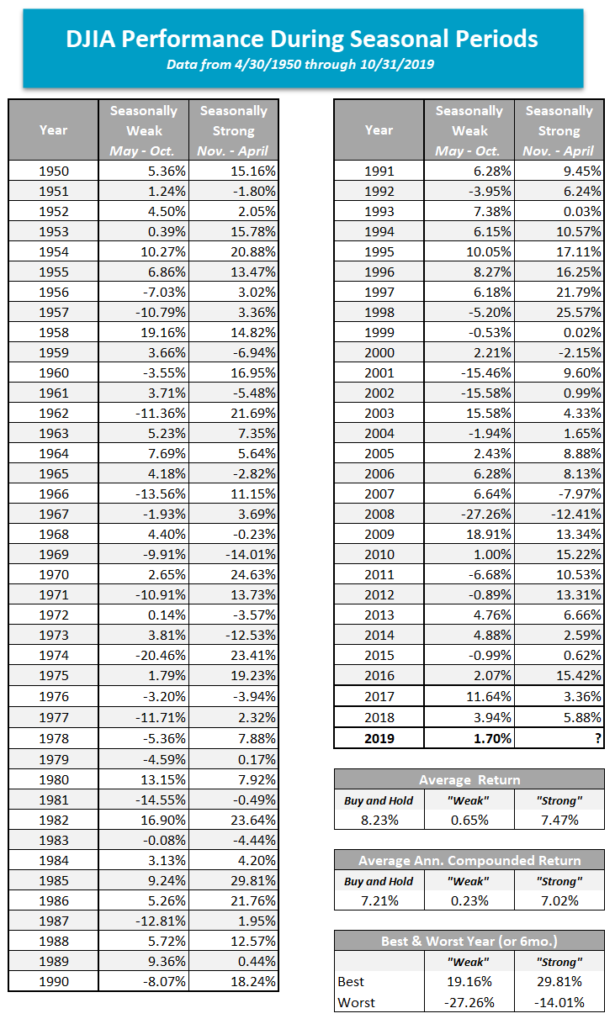
Consider the benefits of a disciplined approach to the “seasonally strong” half of the year and how that improves results (and more than compensates you for finding the right family office). The average return of the DJIA (Dow Jones Industrial Average) during the seasonally strong November to May time frame is 7.47% annually, versus May to October returning an average of .65%. At Pulliam Family Office, we have adjusted our quarterly rebalance of portfolios away from the typical calendar quarter to reflect this seasonal benefit.
Consider the below insights provided by investment advisory firm Nasdaq Dorsey Wright at the start of the month:
With the start of November, we have also officially moved into the “seasonally strong” half of the year, which lasts from November through April. We are all familiar with the saying “sell in May and go away,” which conjectures that we would do just as well to sell all of our holdings as we would be invested in the market during the months of May through October. Typically, conjecture doesn’t mature into adage without basis in reality and market seasonality is just such an example as it has shown an impressive trend in terms of magnitude, consistency, and longevity. We’ve discussed seasonality many times over the years and as we switch between seasonally biased periods, we wanted to revisit the subject today.
The end of the day’s trading on Halloween (yesterday) also brought with it the end of the seasonally weak period, which began with the close of the market on April 30th. Over this period, the Dow Jones Industrial Average DJIA returned 1.70%, which is well above the average return during the seasonally week period.
Years ago, we began using the Stock Trader’s Almanac, a reference tool published by Yale Hirsch. Ever since then, the Almanac has been a fantastic source of information on the stock market. In fact, we always order a number of copies for the office each year (if you would like a copy, you can visit www.stocktradersalmanac.com). The premise of the “Market Seasonality” study is that historically speaking, the market performs far better during the November through April time period than it does from May through October. On its own, that isn’t a particularly profound statement, however, when we examine the magnitude of this effect over the years, its significance becomes clear. Consider this: if you had invested $10,000 in the Dow Jones on May 1st and sold it on October 31st each year since 1950, your cumulative return would be only about $1,700. Meanwhile, the same $10,000, invested only during the seasonally strong six months of the year, would now be worth over $1.25 million! Put another way, almost all of the growth of the Dow Jones Index since 1950 has effectively during “good” six months of the year.
In the graph below, we have reproduced the US Market Seasonality strategy that was first published in the Stock Trader’s Almanac beginning in 1950 based upon the Dow Jones Industrial Average. The green line reflects the May 1st through October 31st period, while the red line shows November 1st through April 30th. You will note that a theoretical $10,000 initial investment in 1950 is barely on the positive side when invested only from May 1st through October 31st. On the other hand, an identical $10,000 initial investment grew to more than $1,080,041 with an average annualized return of 7.02% if invested only from November 1st through April 30th each year.
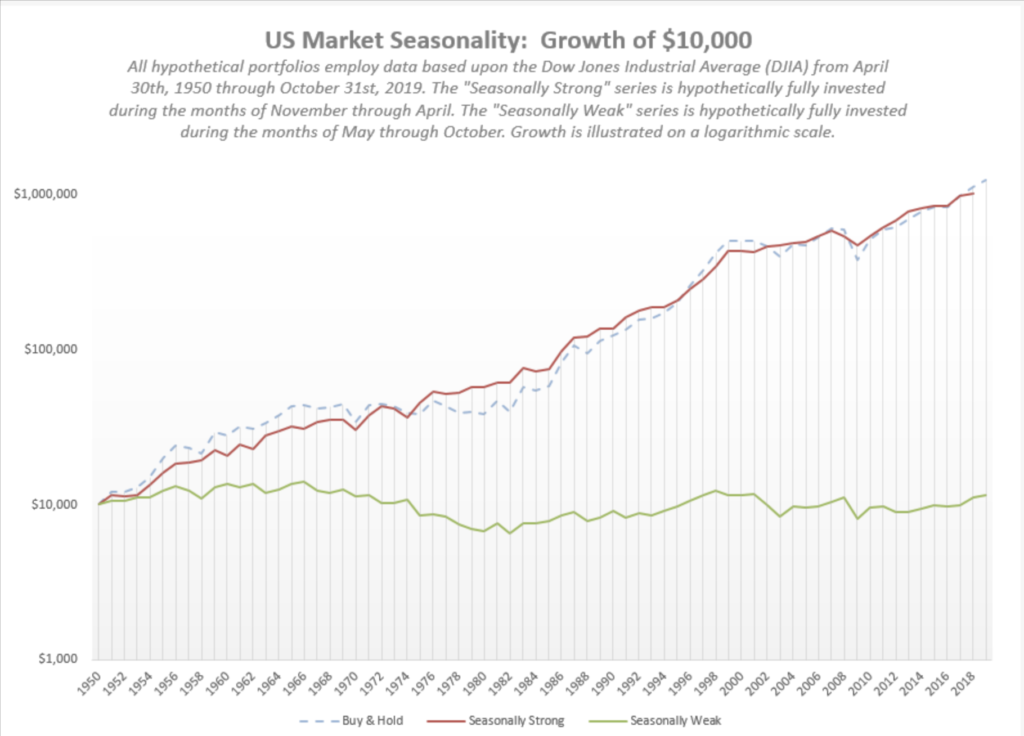
There’s no question that the November through April period has provided substantially better returns. Whether you average it out, annualize it, compound it, or complicate it further; there is clearly a widespread between the average six-month returns during these contrasting seasonal periods.
Market Seasonality Notes:
- Since April 30th, 2000, the Dow Jones Industrial Average DJIA has gained over 152%. However, the Index is up just over 1.62% when we isolate the seasonally weak periods since 1950.
- During the seasonally weak May to October periods, 27 out of the 69 years examined finished down, while there were only 14 years during which the seasonally strong period produced a negative return.
- There have been only three years when the “good six months” have lost more than 10% (1969, 1973 and 2008), while the “bad six months” have seen losses of 10% or more 11 times.
- There have been 15 instances since 1980 where the “good six months” have posted a double-digit return, with five of those returning more than 20%.
- Interestingly enough, following the times when the “bad six months” did produce double-digit losses (11 total since 1950), the “good six-month” period afterward lost more than 1% only once (2008) and on four occasions, actually posted double-digit positive returns (1962, 1966, 1971, & 1974)
- Beginning in November 2009, the Dow experienced a streak of four consecutive positive double-digit efforts during the strong six-month periods, the second-longest such streak in history. The first began in 1994 where the Dow finished the seasonally strong period with double-digit gains for five consecutive periods.
Obviously, this study is not a sophisticated tool for risk management, but it is interesting and does expose biases within the market that many investors are not aware of. As we mentioned above, we are coming off a seasonally weak period in the market which saw the DJIA produce a gain of 1.70%. Despite the elevated volatility felt throughout the most recent seasonally weak period, US equities remain the top-ranked asset class in DALI with 302 buy signals in its favor, a position that it has held for just over three years. With today’s (11/1) action, we have seen major US indexes such as the S&P 500 Index SPX and the Nasdaq-100 Index NDX rally to new all-time highs, in addition to last week’s reversal up into Xs on the Bullish Percent for NYSE BPNYSE. And we are now entering what has been the traditionally strong period for the market. While this does not guarantee that we will see a strong equity market over the next six months, it does provide an opportunity to consider seasonal strategies that can position portfolios to take advantage of these historical biases. We will discuss a few such strategies in this report over the next couple of days.
*All return data is based upon the Dow Jones Industrial Average (DJIA) from April 30th, 1950 through October 31st, 2019. The “Seasonally Strong” returns are based upon investment during the months of November through April (of the following year). The “Seasonally Weak” returns are based upon investment during the months of May through October. Performance of the switching strategy is the result of back-testing. Back-tested performance results have certain limitations. Such results do not represent the impact of material economic and market factors might have on an investment advisor’s decision-making process if the advisor were actually managing client money. Back-tested performance also differs from actual performance because it is achieved through the retroactive application of a model investment methodology designed with the benefit of hindsight. The performance numbers above are pure price returns, not inclusive of dividends or all potential transaction costs. Investors cannot invest directly in an Index. Past performance is not indicative of future results. Potential for profits is accompanied by the possibility of loss.
For help crafting a disciplined approach to your asset management, schedule an appointment with Pulliam Family Office. To learn more about Nasdaq Dorsey Wright, click here.
The attached research DJIA research report was prepared and published by a third party, and is being provided to you by Raymond James Financial Services, Inc. solely for informative purposes. Any person receiving this report from Raymond James Financial Services Inc. and/or its affiliates should direct all questions and requests for additional information to their financial advisors and may not contact any analyst or representative of the third-party research provider. Neither Raymond James Financial Services, Inc. nor any third-party research provider is responsible for any action or inaction you may take as a result of reviewing this report or for the consequences of said action or inaction.
Any information is not a complete summary or statement of all available data necessary for making an investment decision and does not constitute a recommendation. Past performance is not a guarantee of future results.
The Dow Jones Industrial Average (DJIA), commonly known as “The Dow” is an index representing 30 stock of companies maintained and reviewed by the editors of the Wall Street Journal.
The S&P 500 is an unmanaged index of 500 widely held stocks that is generally considered representative of the U.S. stock market.
The NASDAQ-100 (^NDX) is a stock market index made up of 103 equity securities issued by 100 of the largest non-financial companies listed on the NASDAQ. It is a modified capitalization-weighted index. … It is based on exchange, and it is not an index of U.S.-based companies.